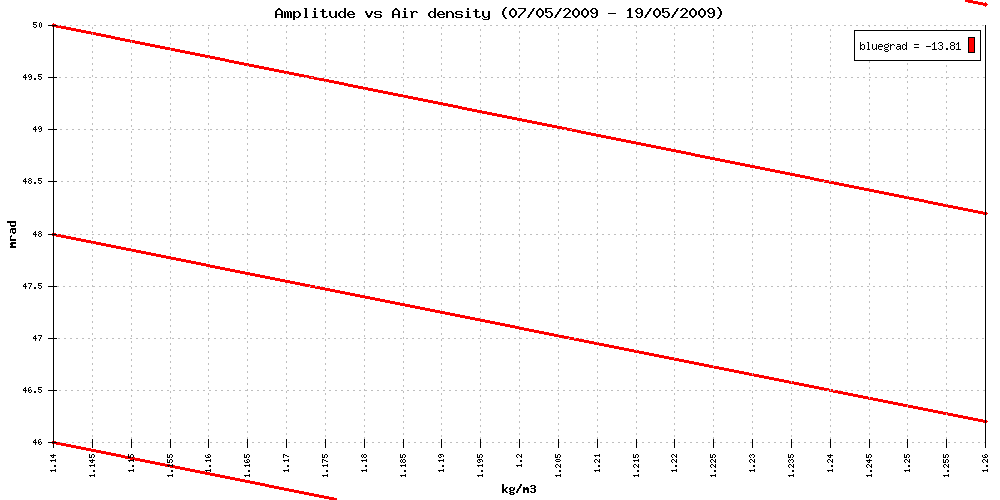
Best fit to data (blue line). Reference gradient (red lines):-15mrad/kg/m3.
Amplitude varies with density because of drag
- 19 May 2009 [15:44]
- Another curiosity is that small changes of Going vs Amplitude [link] shows a positive slope - not sure why. And there seem to be clusters - as if behaviour changes quickly and sits still for a while. The normal physics of a pendulum [link] predicts a negative slope, as here [link] so there is something more subtle going on. Maybe the spider again?
- 19 May 2009 [14:58]
- Just a general remark, it has been noticeable over the last few days that pendulum amplitude forms a nice linear relationship with air density. This fits perfectly with a 0.5*rho*V^2 drag law. see [link]
- 19 May 2009 [12:05]
- clock wound at 1.05pm - note the small glitch in amplitude, perhaps opening the clock case causes air currents that causing a small change in pendulum motion. Or maybe the act of winding moves the clock bed slightly causing the pendulum to be disturbed.
- 17 May 2009 [00:00]
- ... and why has it suddenly changed back at midnight? There is no change in anything else - some physics not accounted for here!
- 14 May 2009 [23:30]
- What caused this gradual change in going, over 8 hours before and after midnight?
- 12 May 2009 [12:05]
- clock wound at 1.05pm. temp is stable and going seems to be spot on zero. Might this last until October now?
Download data