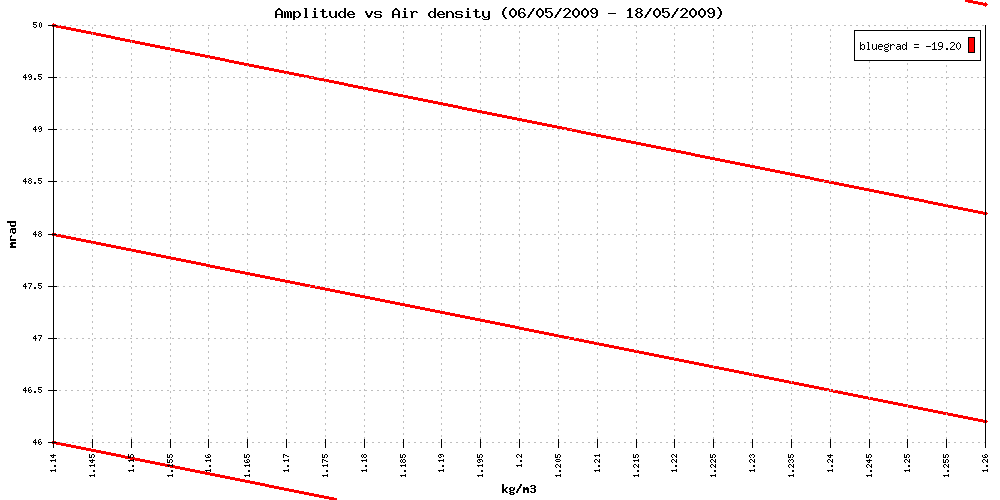
Best fit to data (blue line). Reference gradient (red lines):-15mrad/kg/m3.
Amplitude varies with density because of drag
- 17 May 2009 [00:00]
- ... and why has it suddenly changed back at midnight? There is no change in anything else - some physics not accounted for here!
- 14 May 2009 [23:30]
- What caused this gradual change in going, over 8 hours before and after midnight?
- 12 May 2009 [12:05]
- clock wound at 1.05pm. temp is stable and going seems to be spot on zero. Might this last until October now?
- 06 May 2009 [09:00]
- the spider again? Things settle down well after this - back to normal and very good running.
Download data