Estimates of Going and Drift use: Going = 12.9*(Temp-16) - 8.616*(Pressure-1014.2) - 40*dTemp/dt

- 31 Dec 2010 [11:30]
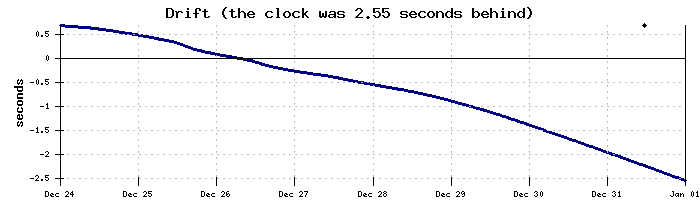
- It is hard to tell how well the barometric and temperature compensators are working because temperature and pressure change at the same time. This is where the monitor page come in [link] because an equation for working out drift from temperature and pressure data can be tested. The equation I am testing is: Going = -120*(Temp-6)-8*(Pressure-1013)-40*dTemp/dt -60) and it fits pretty well. Here is a direct link to the drift estimate and the actual drift - a good fit [link] and the XY plot [link] shows a straight line. If this equation is right then it means that the variation of going with temperature is -120 ms/day per deg C [-520] , with pressure is -8 ms/day per mbar [-8] and with rate-or-change of temperature is 40 ms/day
- 31 Dec 2010 [11:29]
- per degC/day [0]. The values in [ ] are for an uncompensated pendulum.
Download data