Best fit to data (blue line). Reference gradient (red lines):9twist/mrad/tilt/mrad.
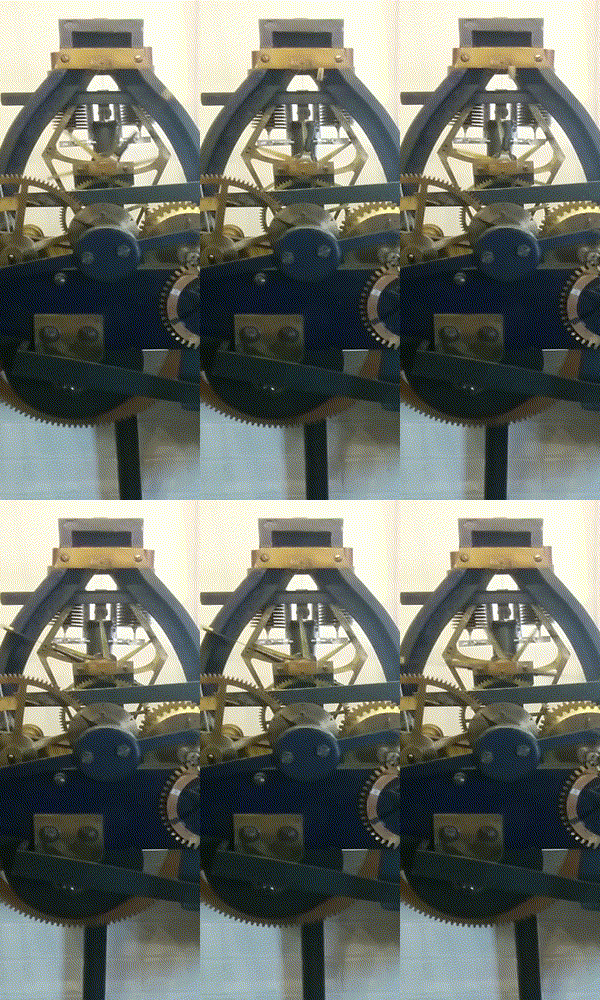
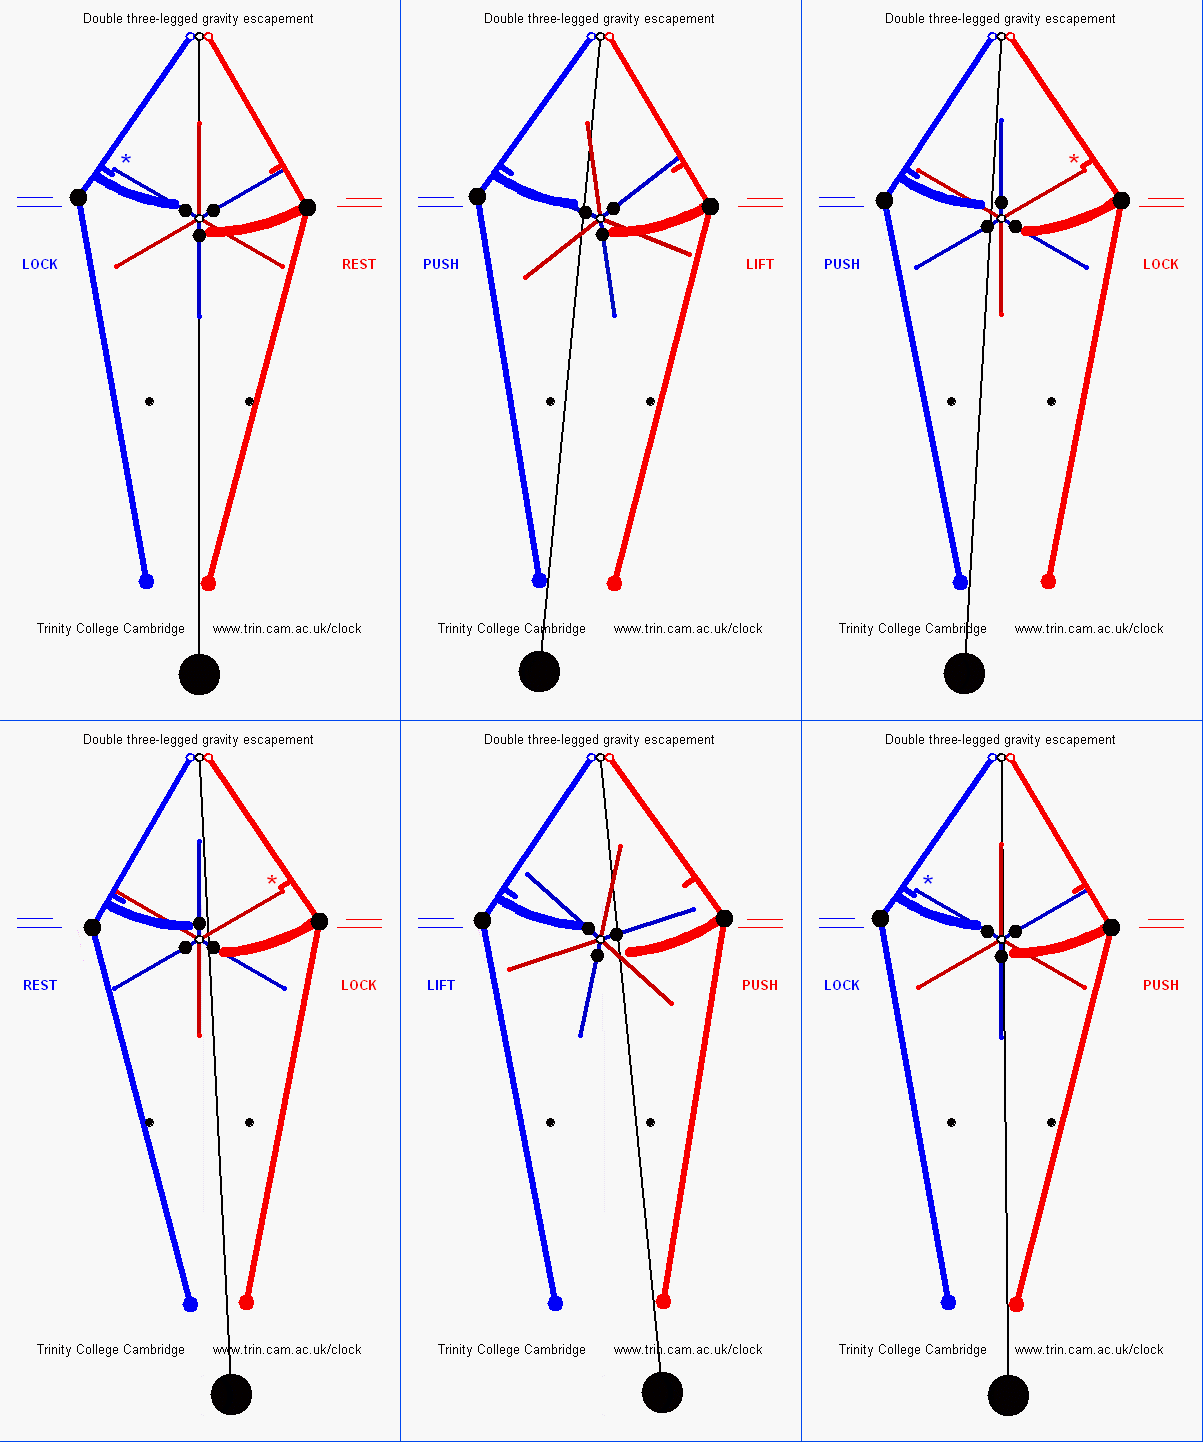
If the pendulum is not swinging in a vertical plane, this couples into a twisting motion.
- 26 Jan 2018 [17:35]
- end of experiment. [link] I reckon the shift of weight was about 0.25kg by 40mm - that's the same as 100kg by 0.1mm The pendulum bob is 100kg and the length is about 2m so the apparent tilt change is about 0.05mrad Look at x-y plot here of twist vs tilt (nb tilt volts is 1mrad/volt). [link] So it looks as if the 0.05mrad is in the right ballpark.
- 26 Jan 2018 [15:00]
- experiment to see if shifting 20000ms worth of regulation weights makes any difference to twist. Looks promising
Download data


