From to [ Shift -1 day | Shift +1 day ] Zoom menu visibleinvisible
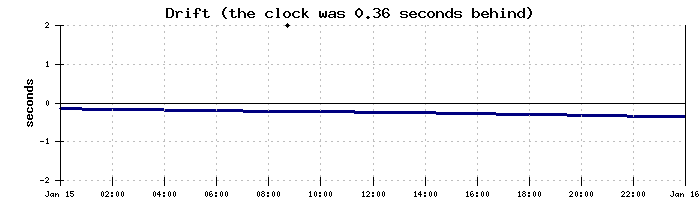
Plot DriftAmplitudeGoingAir tempHumidityAir pressureAir densityClock tiltPendulum twistPendulum twist phaseCavity bottom tempCavity temp 2Cavity temp 3Cavity temp 4Cavity temp 5Cavity top tempRoving temp probeCavity tempsCavity temp 5 - top tempSunshineBottom of bubbleTop of bubbleBubble endsBubbleOutdoor temperatureOutdoor humidityClock bubblePendulum bubbleTower bubble and (none)DriftAmplitudeGoingAir tempHumidityAir pressureAir densityClock tiltPendulum twistPendulum twist phaseCavity bottom tempCavity temp 2Cavity temp 3Cavity temp 4Cavity temp 5Cavity top tempRoving temp probeCavity tempsCavity temp 5 - top tempSunshineBottom of bubbleTop of bubbleBubble endsBubbleOutdoor temperatureOutdoor humidityClock bubblePendulum bubbleTower bubble as time plot(s)scatter plotcloud plot with fixed scaleauto scale
TimeDriftAmplitudeTempHumidityPressureNum pts averaged over (two cols: clock & weather)
Interval between data points: seconds [either 3 seconds (weather data is duplicated) or multiples of 60 seconds (all data is averaged)].
[Raw data: Clock | Weather]